Experiment 3 used two narrow bands of noise which were linearly spaced around the signal frequency. At the intermediate sound levels used, it was assumed that each band would be attenuated by the auditory filter centred on the signal frequency by a similar amount. This is very likely to be an over simplification. Auditory filters are roughly symmetric on a linear scale at moderate levels, but at higher levels the low frequency skirt tends to be more shallow than the high frequency skirt. As sound level increases, the lower frequency skirt gets more and more shallow, meaning that maskers at a lower frequency than the signal are attenuated less (Moore and Glasberg, 1987). The so-called phenomenon of the 'upward spread of masking' is well known. It is possible therefore that at the masker levels used in Experiment 3, the lower frequency masking band was responsible for most of the masking. If such an asymmetry was found, then a within-channel explanation would predict that if the level of both masker bands was decreased, the two masking bands would have a more even contribution (perhaps even swapping over the dominance at low levels). On the other hand, it is a fair assumption that frequency separation and masker level would have little effect on an across-channel process.
In Experiment 3, the two masking bands were always correlated with each other and presented at the same level. It was difficult to assess the relative contributions of the two bands. In Experiment 4, the correlations of the masker bands with the signal band were individually altered. The masker level was also systematically altered. Any asymmetry in the results (especially if level dependent) would be strong evidence of a within-channel effect. The results of Moore and Schooneveldt (1990) show that in a dichotic CMR experiment (i.e. across-channel only) with a similar noise bandwidth to that used in the experiments described thus far, the magnitude of the CMR is virtually the same at negative and positive separations of the on-frequency and flanking bands (i.e. f-Df = f+Df).
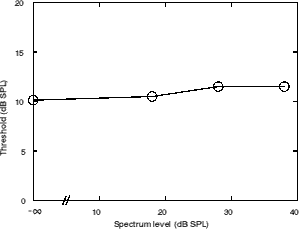
The task in experiment 4 was to detect a 20-Hz wide noise signal. The signal was centred at 1500 Hz. The signal was masked by two 20-Hz wide bands of noise centred at 900 and 2100 Hz (corresponding to a Df of 600 Hz). The masking noises were presented at spectrum levels of 45, 55 and 65 dB SPL. A continuous low-pass noise with a -3 dB point of 400 Hz was presented with the maskers. The level of the noise was set so that it had a spectrum level 27 dB SPL lower than that of the masking bands at 300 Hz (the frequency at which cubic combination bands would be produced). It was possible that the low-pass noise was responsible for a proportion of the masking even though it had a very sharp cut-off (four 48 dB/octave filters were used in series) and was presented at quite a remote frequency. Therefore, it was possible that altering the low-pass noise level may have affected the thresholds. To test this, during pilot trials, the signal thresholds were measured without the narrow band noise maskers. Only one subject was used for this. The task was therefore simply to detect the signal with the continuous low pass noise. Three different noise spectrum levels were used; 18, 28 and 38 dB SPL at 300 Hz. These correspond to the levels used in the experiment proper. The pilot experiment was also performed with no background noise at all. Figure 5.1 shows the thresholds for the signal. It is clear that altering the level of the background noise had a negligible effect on the signal threshold.

Figure 5.1. The effect on signal threshold of altering the spectrum level of a constant low pass noise. No other maskers were present.
Five different combinations of masker modulation patterns were used. Figure 5.2 shows the patterns used in the same manner as that used in the description of Experiment 1.
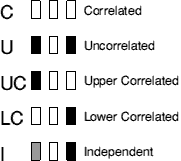
Figure 5.2. The 5 different conditions used in Experiment 4. The centre white block represents the signal at 1500 Hz. The other boxes represent the bands of noise that make up the masker (900 and 2100 Hz). Similarly shaded blocks are comodulated.
The bands of noise were generated by the same method as the bands used in the previous experiments. The same apparatus was also used to control the stimuli. A low pass noise was added to mask possible combination bands. The low pass noise was produced by filtering a white noise (Hewlett Packard 3722A) using four 48 dB/Octave low pass filters (Kemo VBF/8) in series.
Masked thresholds were estimated using a three-alternative forced-choice method with an adaptive three-down one-up procedure estimating the 79.4% point on the psychometric function. The initial step size was 5 dB. After three reversals, the step size was decreased to 2 dB. A run was terminated after 12 reversals. The threshold was defined as the mean of the levels at the last eight reversals. Three thresholds estimates were obtained for each condition, and a fourth was obtained if the range of the first three exceeded 3 dB. The final threshold value was taken as the mean of these three (or four) estimates. Subjects were tested individually in a double-walled sound-attenuating booth. Feedback was provided on the response box.
Four subjects participated, all with absolute thresholds less than 10 dB HL at all audiometric frequencies. Subjects SB, DM and GEM had experience of the stimuli used having been used for previous experiments. Subject JR was a new subject. All subjects were given as much practice as they needed to become stable on the conditions used (generally less than 4 hours was needed). JR was given more practice having had no previous experience. JR was not tested at the middle noise level (55 dB SPL).
The results of Experiment 4 are shown in figure 5.3. Figure 5.4 shows the same results but with thresholds expressed as signal-to-masker ratio in dB.
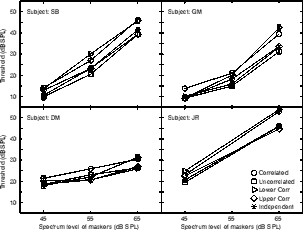
Figure 5.3. The results of Experiment 5 in which the modulation characteristics and level of the masking bands are systematically altered. Errors bars show the standard deviation.
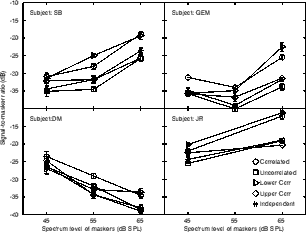
Figure 5.4. The results of Experiment 5 in which the modulation characteristics and level of the masking bands were systematically altered. The thresholds are presented as the signal-to-masker ratio in dB. Error bars show the standard deviation of the measured thresholds.
At the high masker levels used in the previous experiments (65 dB SPL), the results fall clearly into two groups; the conditions in which the lower band is correlated (C and LC), which give higher thresholds, and the conditions in which the lower band is uncorrelated (U, UC and I) which give lower thresholds. The modulation characteristic of the upper band is unimportant. This is very strong evidence for upward spread of masking and a within-channel basis to the CDD. This explanation would predict that as the masker level is reduced, the upper band would become at least as important as the lower band. Results for symmetric conditions such as C, U and, for the purposes of this discussion, the independent condition (I) would be expected to remain in the same relative position. Results for the asymmetric conditions (LC and UC) should become more equal or possibly even cross over as the dominance swaps between the lower band and the upper band. To illustrate that this is the case, figure 5.5 shows just the results for the LC and UC conditions.
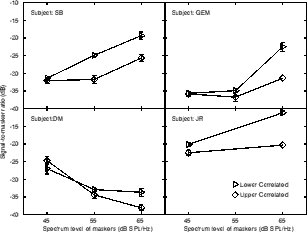
Figure 5.5. A subset of the results of Experiment 5 in which the modulation characteristics and level of the masking bands were systematically altered. The thresholds are presented as the signal to masker ratio in dB. Only the conditions in which one and only one of the masking bands was correlated with the signal are shown. The error bars show the standard deviation of the results.
All four subjects show results that tend in the predicted direction. A 2-way within-subjects ANOVA was performed with main effects being upper/lower correlation condition (LC vs UC) and spectrum level (65 vs 45 dB SPL). Each effect was significant (p=0.033, F(1,3)=14.16 for correlation condition; p=0.014, F(1,3)=26.57 for level). The interaction between correlation condition and spectrum level was found to be significant (p=0.002; F(1,3)=114.79). A Scheffé post-hoc analysis was performed on this interaction and it was found that a significant difference between correlation conditions only occurred at the higher spectrum level. This ANOVA design did not allow differences between subjects to be analysed so individual Bonferroni-corrected t-tests were performed between the LC and UC conditions at each level. The difference for each subject was significant with the 65 dB SPL masker (t(4) for DM was 7.82; p=.005. For all other subjects p<.001). At the 45 dB SPL masker level, subjects varied. For subject DM, thresholds for the two conditions did indeed cross over (t(4)=2.94; p=0.05). For subjects GEM and SB, the difference between the two conditions was not significant at the p=0.05 level (t(4)[GEM]=0.54; t(4)[SB]=2.14). For subject JR the difference was much reduced at the lowest masker level, but remained significant (t(4)=5.84; p=0.01). Calculated excitation patterns (Moore and Glasberg, 1983, 1987) for a number of different masker levels (with the signal at the threshold measured in the correlated condition) are shown in figure 5.6.
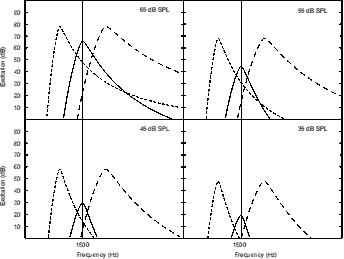
Figure 5.6. Calculated excitation patterns for a number of different masker spectrum levels. The thin vertical lines indicate the signal frequency.
The excitation patterns clearly show the dominance of the lower band at the higher masker levels. Only at masker spectrum levels as low as 45 dB SPL does the excitation from the two bands approach equality.
The results of experiment 4 provide very strong evidence that the masking is mediated by conventional within-channel processes. Across-channel processes have been shown to be generally independent of the level of the flanking bands (within limits) (Schooneveldt and Moore, 1987; Moore and Emmerich, 1990; Moore and Shailer, 1991), so it is unclear how an across-channel mechanism could produce such results.