Experiment 1 provided a clear demonstration of CDD. The large number of conditions involved made the results somewhat difficult to analyse. Increasing the number of bands increases the number of band interactions. It is possible for combination bands produced by the interaction of masker bands to contribute to the masking of the signal. All the bands in experiment 1 were fixed in frequency and were logarithmically spaced so that they were the same distance apart in ERBs. If CDD is due to a within-channel effect, it may be dependent upon the frequency separation of the bands. Certainly, the masked thresholds themselves should be strongly affected. Gross changes such as removing the inner pair of bands do not provide a good method of investigating the effects of frequency separation. Also, at medium sound levels psychophysical tuning curves (PTCs) are approximately symmetrical on a linear axis (at least for the tip region). The individual members of each pair of bands in experiment 1 would have been attenuated by the auditory filter centred on the signal by differing amounts, as the bands were uniformly spaced on an ERB scale, which is not linear (Glasberg and Moore, 1990).
Experiment 3 was designed to be more of a pure masking experiment. The paradigm was based on two-tone masking (after Zwicker, 1954) in which a narrow band noise signal (at centre frequency f) is placed in between two sinusoids (at frequencies f±Df). In such an experiment, two maskers are used to try to minimise the effect of off-frequency listening (Johnson-Davis and Patterson, 1979; O'Loughlin and Moore, 1981). In the experiment described here, narrow bands of noise were used as maskers instead of sinusoids. The correlation of the masker bands with respect to the signal band was altered, allowing CDD to be measured. As there were only two bands which could be easily altered in frequency, this made it possible to assess the effects of frequency separation on CDD. Three signal conditions were used; correlated, uncorrelated and sinusoidal. The sinusoidal signal condition was used as it corresponds most closely to standard two-tone masking (Fastl and Schorer, 1986). The results of two-tone masking experiments have never been discussed in terms of perceptual grouping, even by the most ardent advocate of grouping. They are generally regarded as providing a measurement of the auditory filter shape. Therefore, using a sinusoidal signal allows a comparison of a non-grouping condition with CDD conditions that have previously been assumed by some workers to be mediated by grouping processes.
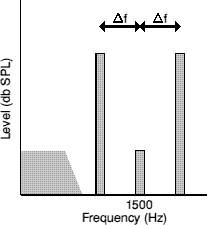
The task in experiment 3 was to detect a signal which was either a 20Hz wide band of noise or a sinusoid, in a paradigm analogous to two-tone masking (Zwicker, 1954). The signal frequency (fs) was 1500 Hz. Two masking bands of noise which were correlated with each other were presented, centred at frequencies of fs-Df and fs+Df. The linear separation Df was varied between 200 Hz and 1400 Hz in steps of 200 Hz. A 429Hz separation was used instead of the 400 Hz separation, thus meaning that the frequencies of the innermost bands in experiment 1 were represented. Two subjects were also presented with 100- and 300Hz separations. There were 3 different signal conditions: Correlated (where all 3 bands of noise had correlated amplitude modulation), Uncorrelated (where the masking bands were correlated with each other, but the signal was uncorrelated) and Sinusoidal (where the signal was a sinusoid of the same overall power). The masker bands had a spectrum level of 65 dB SPL. The sinusoid had a level of 78 dB SPL.
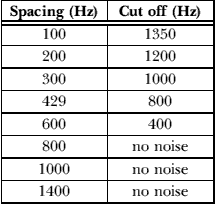
The bands of noise were generated by the same method as the bands used in Experiment 1. The same apparatus was also used to control the stimuli. A low-pass noise was added to mask possible combination bands. The low-pass noise was produced by filtering a white noise (Hewlett Packard 3722A) using four 48 dB/Octave low pass filters (Kemo VBF/8) in series. Such a steep cut off was necessary to ensure that at small Df there was negligible masking of the lower noise band. The -3 dB point of each filter was set to the values shown in Table 4.i. The level of the low pass noise was then adjusted so that it had a spectrum level of 38 dB SPL at the frequency fs-2Df (i.e. the frequency at which a cubic-difference tone may be present). No noise was needed for spacings greater than 0.5fs (i.e. 750 Hz) as fs-2Df would be negative in these cases. The noise was presented continuously.

Table 4.i. The cut off frequencies used for the different spacings in Experiment 3.

Figure 4.1. A pictorial representation of the stimuli used in Experiment 3.
Masked thresholds were estimated using a three-alternative forced-choice method with an adaptive three-down one-up procedure estimating the 79.4% point on the psychometric function. The initial step size was 5 dB. After three reversals, the step size was decreased to 2 dB. A run was terminated after 12 reversals. The threshold was defined as the mean of the levels at the last eight reversals. Three thresholds estimates were obtained for each condition, and a fourth was obtained if the range of the first three exceeded 3 dB. The final threshold value was taken as the mean of these three (or four) estimates. Subjects were tested individually in a double-walled sound-attenuating booth. Feedback was provided on the response box.
Three subjects participated, all with absolute thresholds less than 10 dB HL at all audiometric frequencies. All subjects had experience of psychophysical experiments having previously completed Experiment 1. All subjects were given as much practice as they needed to become stable on the conditions used (generally less than 4 hours was needed).

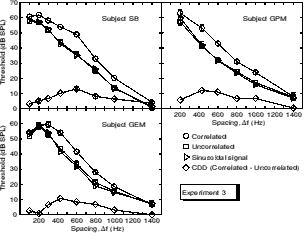
Figure 4.2. The results of Experiment 3. The masking bands were centred at fs±Df at a spectrum level of 65 dB SPL. The error bars shows the standard deviation of the measured thresholds.
The results of Experiment 3 are shown in Fig 4.2. The results are broadly similar across subjects. Thus the mean results are presented in Fig 4.3.

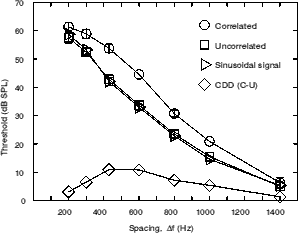
Figure 4.3. The results of Experiment 3 presented as the mean across 3 subjects. The masking bands were centred at fs±Df at a spectrum level of 65 dB SPL. The errors bars show the mean standard deviation.
The results show a maximum CDD at separations of 429 and 600 Hz. These are exactly the separations of the innermost bands in experiment 1. This could be explained by a 'sweet-spot' or preferred separation in the auditory system for which grouping is most likely to operate. It is not clear why such a bias should exist. Indeed, many components that would be grouped in real life would be harmonics of a fundamental less than 400 Hz, e.g. speech. It would be disadvantageous not to group such components. The results of Moore and Schooneveldt (1990) show a consistent rise in both the monaural CMR (i.e. within-channel at narrow separations) and dichotic CMR (i.e. across-channel) as the frequency separation decreases between the flanking band and the on-frequency band. If CMR depends on grouping, this implies that grouping mechanisms are more effective for narrow spacings. Nonetheless, a decline in CDD at small separations has been taken as evidence of an across-channel mechanism (Wright, 1990). The decline in CDD at small separations may be connected with the prominent beating caused by the interaction of the signal and masker bands. This would provide an extra cue for signal detection. Furthermore, the magnitude of the beats in the correlated condition will be at least as large as in the other two conditions. In the case of subject GEM the thresholds actually decline at the narrowest spacing for all conditions. All subjects reported a roughness in the 100- and 200Hz spacing conditions.
The decline in CDD as the spacing increases is similar to the results of Schooneveldt and Moore (1989b) for CMR. A noise which was varied in bandwidth was centred on a sinusoidal signal in a CMR paradigm. The measured thresholds showed a plateau when the bandwidth was greater than three critical bandwidths (i.e. 1.5 critical bandwidths on each side of the signal). Therefore, adding similarly correlated noise further away does not alter the threshold. The estimated width of the critical band with a centre frequency of 1500 Hz is 180-230 Hz (Scharf, 1970; Moore and Glasberg, 1983). One and a half critical bandwidths are therefore 270-345 Hz which about half of the 600 Hz spacing point at which the CDD in the current experiment begins to decline. However, in the experiment of Schooneveldt and Moore (1989b), as comodulated energy was placed further away from the signal frequency, there was still comodulated energy nearer to the signal frequency. It is therefore possible that the maximum advantage of the comodulation cues was reached at three critical bandwidths and additional comodulated energy at more remote frequencies was superfluous. Perhaps if there had not been energy immediately surrounding the signal, information further away would have continued to have a large effect. The results of Moore and Schooneveldt (1990) show a decline in the magnitude of CMR as the flanking band is moved away from the signal frequency, but a significant CMR is still seen at very large spacings (at least for bandwidths comparable to those used in the present experiment).
The decline in CDD for spacings above 600 Hz is easily explained by a within-channel view. The curves shown (especially those for the sinusoidal and uncorrelated conditions) look like auditory filter shapes (Patterson, 1976). Off-frequency listening should be small assuming the filter is roughly symmetric, and given that two masking bands were used on either side of the signal frequency (unlike Cohen and Schubert, 1987b). As the spacing of the bands increases, the masking bands are attenuated more and hence less noise energy passes through the channel centred at the signal frequency. Eventually, the masked threshold approaches the absolute threshold for both the correlated and uncorrelated conditions, and the CDD inevitably declines.
In the discussion of Experiment 1, it was suggested that the CDD was due to a correlated band making signal detection harder rather than an uncorrelated band facilitating detection. It was argued that this was a strong point in favour of a within-channel mechanism. In Experiment 3, this is demonstrated much more clearly. The sinusoidal signal represents a base-line condition; a standard masking condition that has not previously been considered in terms of grouping (not even by the strongest advocates of grouping mechanisms). The results for the uncorrelated condition are more than similar to those for the sinusoidal base-line condition; they are virtually identical. The CDD is therefore entirely due to a increase in threshold in the correlated condition.
If one regards the data presented in Fig 4.2 as representing filter shapes, it could be said that filter shapes are broader for correlated maskers. Carlyon (1989) performed an experiment which appears to give similar results, although at first glance it has little in common with the experiment described here. Carlyon used a sinusoidal signal masked by a notched noise. The notch width was systematically altered. This is very similar to the method used by Patterson (1976) to measure filter shapes. However, the stimulus could be preceded by a burst of a similar notched noise which was separated from the masker and signal by a small silent interval. When such a primer noise was presented, the threshold for detection of the tonal signal was reduced. Moreover, the largest decrease was seen at notch widths of 20-30% of the signal frequency. In the experiment described here, the 429- and 600-Hz spacings correspond to 28% and 40% of the signal frequency which are very similar. To help understand the relationship between the two experiments, one should realise that they both use methods of altering correlation. In Carlyon's experiment, the signal and masker duration were very short (5 ms). Therefore, the relative onsets of the masker and signal could be used as a cue for grouping. When no priming noise is presented, the masker and signal will have identical onset times which corresponds to perfect correlation. When the primer is presented (which was identical in spectral form to the masking noise), it is likely that the correlated onset of the upper and lower flanks of the notched noise would separate the signal from masker perceptually. The short time delay between the primer offset and the masker/signal onset was not long enough to destroy such an effect. It is likely that an across-channel grouping mechanism is responsible for the the results of Carlyon (1989), but just because the results of the both Carlyon's experiment and the present experiment 3 described here show a similar pattern, this does not necessarily imply that they have the same explanation.
By using an analogue of Zwicker's two-tone masking paradigm, it is possible to measure CDD as a function of the frequency separation of the masker and signal. A within-channel mechanism appears to account for the results seen in such an experiment. However, the reason for the decline in CDD at small separations is still not entirely clear. It could be mediated by beating produced between the maskers and the signal.