The within-channel detection model described in chapter 6 successfully predicted that the psychometric function for a signal that was correlated with the masker would have a steeper slope than that measured for an uncorrelated signal. A further test of the model is described here. A time delay between the envelopes of the signal and masker bands was introduced (while retaining a simultaneous onset).
The experiments described previously have all used extremes of correlation. The bands of noise were either completely correlated with the signal or completely uncorrelated. In 'real world' stimuli, it is unlikely that such polarisation exists. One would assume that any mechanisms that have developed in the human auditory system to cope with the grouping or hearing-out of partials have not developed merely so that we may perform psychoacoustic experiments with vastly impoverished stimuli. A small concession to real life would be to use stimuli in which components were only partially correlated. There are a number of ways of producing partially correlated bands. In the experiments described so far, each band of noise was made up of 201 separate sinusoids each of which had a different amplitude and starting phase (described in Chapter 2 and illustrated in figure 2.2). Correlated bands were produced by giving the respective components of the two bands the same amplitude and starting phase. Uncorrelated bands had different amplitudes and phases for the respective components. To make a partially correlated band, the components could have amplitudes and phases at varying points in between the two extremes. This is described further in Appendix 1.
An alternative way of making bands partially correlated is by introducing a time delay between the envelopes of two correlated bands while keeping the onset and offset times identical. This is equivalent to phase shifting each component, but leaving the amplitudes the same.
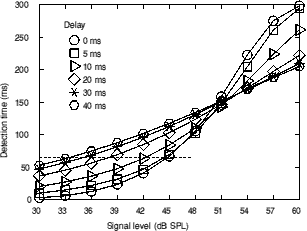
What predictions does the within-channel model described in chapter 6 make when presented with time delayed stimuli? Stimuli with a number of delays between the signal and masker were presented to the model. The results are shown in figure 8.1.

Figure 8.1. The output of the detection time model when presented with stimuli with a number of delays between masker and signal (solid lines and symbols). The horizontal line is at the same level as the upper line in figure 6.7 which is at the time for detection that corresponds to the threshold for the correlated, 600-Hz spacing condition in experiment 3.
The output of the model leads to clear predictions. For short delays, the curves do not greatly depart in position or slope from that for the entirely correlated condition (0-ms delay); they are still very different from that for the uncorrelated condition. For the two longer delays (30 and 40 ms), the curves are very similar in both position and slope to that for the uncorrelated condition. Indeed, if the curve for the uncorrelated condition from figure 6.6 (which is the output of the model when presented with the stimuli from experiment 3) is imposed upon figure 8.1, it falls exactly upon the curve corresponding to a delay of 40 ms. Therefore, the model predicts that as the delay increases the threshold will fall and get closer to the threshold for detection of a completely uncorrelated signal. As the delay approaches 40 ms, the thresholds should approach the same level as those for a completely uncorrelated signal.
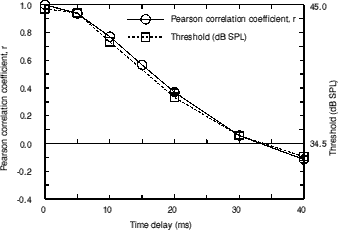
The model was extended slightly to calculate the Pearson correlation coefficient (r) of the envelopes for the masker and signal bands. 100 samples of the masker and signal were taken for each time delay and the correlation coefficient was calculated. The mean value of the coefficient was derived. The results are plotted as the solid line in figure 8.2. The dashed line shows the thresholds predicted from figure 8.1. The predicted thresholds were derived by determining the signal level required to give a detection opportunity time of 59.5 ms (see figure 6.4 for the derivation of this number). The curve showing the predictions has been scaled so that the experimentally determined thresholds for the correlated and uncorrelated conditions in experiment 3 correspond to correlation coefficients of 1.0 and 0.0 respectively. i.e. the 45.0 dB SPL point and the r=1.0 point are aligned as are the 34.5 dB SPL and r=0.0 points.

Figure 8.2. The mean Pearson correlation coefficients for a number of time delays and the predicted thresholds. Error bars show the standard error.
Figure 8.2 shows that the predicted thresholds derived from the model for partially correlated stimuli are directly linearly related to the correlation coefficient of the stimuli. Both the predicted thresholds and the calculated correlated coefficients predict that a delay of just over 30 ms is required to make the masker and signal bands uncorrelated. Interestingly, the Pearson correlation coefficient actually goes negative with a 40-ms delay. This is because the average period of the envelope fluctuations for a 20-Hz wide of noise is approximately 78 ms (Rice, 1954). This corresponds to the average time between adjacent envelope peaks. Therefore, the average time between an envelope peak and the adjacent dip is 39 ms. With a 40-ms delay, there is a small (but non-zero) chance that a peak in one of the bands will be aligned with a dip in the other delayed band. This means that the presence of a peak in one band can be used as a weak predictor of a dip in the other delayed band hence giving rise to a slightly negative correlation coefficient.
In real-life, it is not usually necessary or desirable to hear out correlated channels as separate sources; in fact, grouping correlated channels will usually provide significant advantages. It could therefore be postulated that an across-channel mechanism is automatically engaged for grouping purposes, as such default behaviour is generally to the listener's advantage. With a within-channel mechanism, both the masker and signal bands are passed through the same channel and so no compensation for signal-masker delay is possible. However, with an across-channel mechanism, the masker and signal bands pass through different channels. The outputs of the two channels could be de-synchronised to time-align the envelopes. For instance, when a dip is encountered in the off-frequency channel, the dip-listening process might learn to monitor the signal channel at adjacent points in time. In other words, it might be able to look backwards in time (using some sort of memory) or look forwards by waiting for one envelope period or so. In a CDD experiment, introducing a time delay between the signal and masker envelopes improves detection performance as the correlation between the masker and signal envelopes decreases. This is the opposite of what happens in a CMR experiment, where increasing correlation (e.g. by time aligning) between the on-frequency band and the flanking bands is advantageous. Therefore, in a CDD signal detection task, it is not to the listener's advantage to use a flexible across-channel mechanism to lessen the time delay. However, as discussed above, it may be that an across-channel time-aligning mechanism is engaged automatically, as in real-life situations such a mechanism would improve performance. If, in a CDD experiment, the delay needed to abolish the CDD is greater than the limit of ±30 ms predicted by the within-channel model, this would be evidence of an involuntary across-channel mechanism.
The task in experiment 6 was to detect a 20-Hz wide band of noise centred at 1500 Hz. The signal was presented with a masker consisting of two 20-Hz wide bands of noise. The masking bands were linearly spaced in frequency on each side of the signal band. The spacings used were 429 Hz (1071 and 1929 Hz) and 600 Hz (900 and 2100 Hz). The masker bands were always correlated with each other. The masker bands were derived from the signal band, but were time delayed relative to it. Eight delays were used: -20, -10, -5, 0, 5, 10, 20 and 40 ms. A negative delay implies that the signal leads the masker. A positive delay implies that the masker leads the signal. A low-pass noise with amplitude and cutoff frequency calculated in the same way as for experiment 3 (table 5.i) was presented continuously to mask any possible combination bands. Even though the underlying noises were delayed relative to each other, the masker and signal band were gated simultaneously with 50-ms raised cosine ramps and a steady state duration of 300 ms.
The stimuli were calculated in a similar way to those used in Experiment 3. Two independent 10 second tracks were calculated; one for the maskers and one for the signal. After 10 seconds the tracks could be looped back to the beginning. However, instead of the playback pointers being synchronised between the two tracks as in Experiment 3, they could be moved apart by any number of samples. At a 48 kHz sample rate, there are 48 samples per millisecond. Therefore, it is easy to introduce the desired time delay. Continuous recordings were made onto separate tracks of a DAT tape (Sony 55ES). The control and presentation method were the same as those used in previous experiments.
The same procedure was used as in experiment 1.
Three subjects participated, all with absolute thresholds less than 10 dB HL at all audiometric frequencies. All subjects had extensive practice having previously completed earlier experiments.
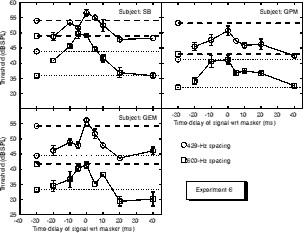
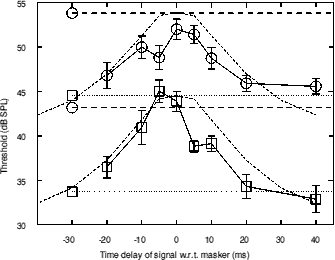
The results of Experiment 6 are presented in figure 8.3. Mean results for all subjects are presented in figure 8.4. The results for the correlated and uncorrelated conditions in Experiment 3 at the 429 Hz and 600 Hz spacing are shown with horizontal dashed and dotted lines. The symbols on the ends of the lines correspond to the spacings used. In detail, the lower dotted line is the previously measured threshold for an uncorrelated signal with a masker-signal spacing of 600 Hz. The upper dotted line is the threshold for a correlated signal with a spacing of 600 Hz. The lower dashed line is the threshold for an uncorrelated signal with a spacing of 429 Hz and the upper dashed line is the threshold for a correlated signal with a spacing of 429 Hz.

Figure 8.3. The results of experiment 6 in which a time delay was introduced between the signal and masker bands. Positive time delays indicate that the signal was delayed with respect to the masker. Negative time delays indicate the reverse. The horizontal dashed and dotted lines indicate the values of the thresholds for the correlated and uncorrelated conditions respectively in Experiment 3 for the two spacings used. The error bars show the standard deviation.
The results show that, as expected, the thresholds for a signal with no delay relative to the masker are roughly the same as those for the correlated condition of experiment 3 for the same spacings. Any small systematic differences may be due to the stimuli being calculated afresh for this experiment. There may be small differences in peakiness of the stimuli each time they are calculated.

Figure 8.4. The results of experiment 6 in which a time delay was introduced between the signal and masker bands. The thresholds shown are the average of 3 subjects (except for the delay of -5 for which they are the average of 2 subjects). The horizontal dashed and dotted lines are the same as those of figure 8.2. The dashed curves shows the predictions of the model. The error bars show the standard deviation.
As the magnitude of the time delay increases, the thresholds drop. They reach the threshold for the completely uncorrelated signal at a delay of about ±30 ms (there is no significant asymmetry). This fits in very well with the predictions of the model. It also fits in with the change in calculated correlation of the noise bands as the time delay increases.
A gaussian noiseband with a bandwidth of 20 Hz has, on average, 12.8 maxima or minima per second (Rice, 1954). The method of generating stimuli was checked by using the model described in chapter 6. One thousand 300-ms samples were calculated and the average number of maxima and minima were measured using the technique described in chapter 6. The results of the the analysis showed that 4.03 minima and 4.07 maxima were present in each 300-ms slice (a mean of 4.05). If there were 4.05 maxima/minima in 300 ms, this means that there would be 13.5 maxima/minima per second. This is a good fit with the mathematically predicted number. If there are 12.8 maxima/minima per second, this means that the average time between one maximum and the adjacent maximum is 78 ms. The average time between a maximum and an adjacent minimum will therefore be about 39 ms. This means that such a delay will cause a peak in the signal on average to be presented during a trough in the masker (or vice versa). Such a delayed signal is shown in figure 8.5.

Figure 8.5. The envelope of a 20-Hz wide band of noise plus an identical copy delayed by 39 ms.
Figure 8.4 shows that the time delay needed to abolish the increase in masking due to the correlated bands is roughly 20-30 ms or slightly greater than half the time between a maximum and the adjacent minimum (19.5 ms).
It is useful to compare the present results with previous work that has measured the effects of delaying one band with respect to another. Several workers have used time delays in CMR experiments (McFadden, 1986; Moore and Schooneveldt, 1990). The results show that introducing a time delay decreases the magnitude of the CMR measured. Moore and Schooneveldt (1990) presented the flanking bands to the opposite ear to the signal and on-frequency band. In such a dichotic paradigm, there cannot be any within-channel mechanism responsible for the differences in CMR; the results are mediated by an across-channel process.
It is not easy to compare the results of the current work with previous work as conditions vary widely (the bandwidths used in other work were usually not as narrow as 20 Hz). However, an analysis based on envelope periods as described above can still be performed. McFadden (1986) used 75- and 100-Hz bandwidths in a CMR experiment. For the 100-Hz bandwidth his results show a very sharp decline in the CMR with a delay of 3 ms followed by a gradual decline with the CMR being entirely gone with delays greater than 15-18 ms. The formula of Rice (1954) states that the number of maxima/minima per second is 0.641 multiplied by the bandwidth. For a 100-Hz bandwidth this equates to 64.1 maxima (or minima) per second or an average of 7.8 ms between adjacent maxima and minima. Experiment 6 shows that a quarter-period delay is sufficient to largely eliminate the CDD. Assuming that this finding applies to other bandwidths, this corresponds to a delay of 3.9 ms for a 100-Hz bandwidth (19.5 ms for a 20-Hz bandwidth). At a delay of 3.9 ms the results of McFadden (1986) show the CMR decreasing threefold, but this reduction still leaves a significant CMR. McFadden (1986) shows that a much larger delay is required for CMR to be abolished (a full period is required).
Moore and Schooneveldt (1990) used a dichotic condition which means that an across-channel mechanism would always be used. They used a number of bandwidths (6.25-, 25- and 100- Hz). These correspond to average envelope periods of 250, 62.5 and 15.6 ms. It is somewhat unfortunate that the maximum delay used was only 20 ms. As would be expected, a 20 ms delay had no effect on the CMR in the 6.25 Hz condition. In the 25-Hz bandwidth condition, a rather slow decline was seen with roughly a threefold decline in the CMR at the maximum delay. The maximum delay was roughly a third of the period by which stage, the results of experiment 6 showed a complete elimination of the CDD. With a 100-Hz bandwidth, the pattern of results was very similar to that of McFadden (1986); there was a sharp decline over the first few milliseconds with a slower decline to a CMR of virtually zero by 20 ms.
There is a weight of evidence that across-channel mechanisms play a role in CMR experiments. Indeed, in the dichotic conditions used by Moore and Schooneveldt (1990), there could be no within-channel mechanisms. As previously discussed, with a within-channel mechanism both the masker and signal are passed through the same channel and so no compensation for signal-masker delay is possible. In a CDD experiment, no compensation is needed or desirable as such compensation would increase correlation, thus increasing the threshold for detection. With an across-channel mechanism, the masker and signal are processed in separate channels. The two channels could be de-synchronised or allowed to slip apart in time. In CMR experiments and in general, limited time-aligning to increase the correlation of channels will improve the performance of across-channel grouping mechanisms. It was postulated that such an across-channel time-aligning mechanism may be involuntary and therefore performance in a CDD experiment might actually be poorer than predicted by a within-channel only model. The much quicker decline of CDD in the current experiment than the decline of CMR in previous earlier experiments is not consistent with such a view. If an involuntary across-channel mechanism was involved in the CDD experiment described here, then one might expect significant CDDs to be measured at delays approaching one envelope period.
In summary, the results of experiment 6 show that a shorter delay is required to abolish CDD than is required to abolish CMR. Some of the CMR results were obtained dichotically in which case they would be mediated by an across-channel mechanism. A model that is only based on a within-channel mechanism predicts the short delays required to eliminate the CDD. The results of both the model and the experiment mirror the drop in correlation as the time delay increases. It seems likely that, in the main, the subjects were using a within-channel strategy to perform the experiment.