All the experiments described so far have used very narrow band noises. The 20-Hz bandwidth means that the noises have approximately 13 peaks and dips per second. This is quite a slow fluctuation rate and is reasonably easy to consciously follow. In the real world we are presented with a wide range of modulation rates. It is useful, therefore, to extend the range of conditions to include higher bandwidths. The majority of previous workers in the fields of CMR and CDD have used wider bandwidths (100 Hz is especially common). It would therefore be easier to compare results if the bandwidths used were comparable. One would expect an across-channel process to have a reduced effectiveness at higher fluctuation rates. This is supported by the literature. In a CMR experiment, Schooneveldt and Moore (1989a) used a single band of noise centred on the signal frequency with a bandwidth between 50 and 3200 Hz. This band of noise was modulated by a low pass noise with a bandwidth ranging from 12.5 to 400 Hz. Bandwidth and modulation rate were varied independently. For all bandwidths, an increase in modulation rate raised the threshold (i.e. the CMR was reduced). This was also true for bandwidths less than the critical band value at the signal frequency. This effect is unlikely to be due to an across-channel mechanism, as it occurred for maskers as narrow as 50 Hz wide, which is far narrower than the critical bandwidth at the 2000 Hz signal frequency. When the bandwidth was wider than the critical bandwidth, the CMRs were larger which indicates there was probably an across-channel mechanism acting. If it is assumed that CMR and CDD use the same within- and across-channel mechanisms, then because of the results of Schooneveldt and Moore (1989a), it could be predicted that both a within-channel and an across-channel mechanism will show a decrease in CDD as bandwidth increases. It is difficult to separate the two because of the paradigm used.
In another CMR experiment, Schooneveldt and Moore (1987) used on-frequency and flanking bands instead of one band increasing in width. This allows the possibility of both monaural and dichotic listening which is a useful aid in separating the contributions of within- and across-channel mechanisms. Their data show a large decrease in the sharply tuned within-channel component of about 7 dB (CMR (U-C)) as bandwidth increases from 25 to 100 Hz. By comparison, the broadly tuned across-channel component decreases by only 3.2 dB over the same range of bandwidths. At similar spacings, the results for the 50-Hz and the 100-Hz bandwidth conditions are very similar. If it is assumed that the across- and within-channel mechanisms are similar in CDD and CMR, then the results of Schooneveldt and Moore (1987) also lead to the prediction that both a within-channel and an across-channel mechanism will produce a decrease in CDD as bandwidth increases, but also that a within-channel mechanism is likely to show a larger decrease.
Carlyon et al. (1989) performed a CMR experiment in which they measured the difference between modulated and unmodulated maskers which they termed the Modulated-Unmodulated Difference or MUD. The MUD corresponds to the CMRs reported by Hall et al. (1984). However, as the results of Hall et al. (1984) and Schooneveldt and Moore (1989a) show, the MUD with masker bandwidths less than the critical bandwidth (CBW) is not zero. Therefore, there is a within-channel contribution to the CMR. Carlyon et al. (1989) instead defined the CMR in terms of the difference in the MUD between uncued (bandwidth of on-frequency band (OFB) less than CBW) and cued conditions (wideband noise as OFB or low pass noise presented in addition to narrowband OFB). Such a definition separates the within- and across-channel components as the CMR is akin to the 'true' CMRs referred to by Schooneveldt and Moore. The across-channel portion of the CMR did not systematically vary with modulation rate over the range used.
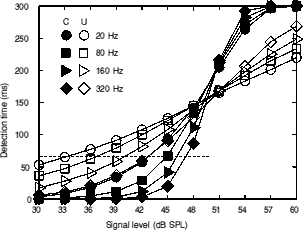
The within-channel CDD model described in chapter 6 was presented with stimuli having a variety of noise bandwidths with a masker-signal spacing of 0.4fs (i.e. the same as the 600 Hz spacing in previous experiments). The results are shown in figure 9.1.

Figure 9.1. The output of the detection-time model when presented with stimuli having a number of noise bandwidths. The filled symbols show the data for correlated signal and maskers. The open symbols show the data for uncorrelated signal and maskers. The horizontal line is at the same level as the upper line in figure 6.7 which is at the time for detection that corresponds to the threshold for the correlated, 600Hz spacing condition in experiment 3.
The model shows that all the slopes steepen with increasing bandwidth. However, a very large change in bandwidth is needed to yield a large change in slope. If the intercepts with the horizontal line are measured, the results can be used as a rough predictor of threshold. The results are shown in table 9.i and figure 9.2.

Table 9.i. The intercepts with the horizontal line in figure 9.1 (corresponding to the detection time for threshold in experiment 3) and the calculated CDD.
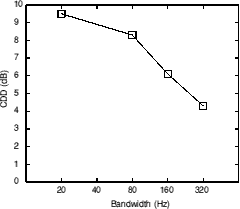
Figure 9.2. The predicted change in CDD with increasing noise bandwidth.
When the bandwidth is increased fourfold, from 20 Hz to 80 Hz, only a small difference in the CDD is predicted. As the bandwidth gets larger, the rate of the decrease of the CDD gets steeper. However, even when the bandwidth is increased by sixteen times to 320 Hz, there is still a significant CDD. The within-channel component of the CMR in the results of Schooneveldt and Moore (1987) showed a very large decrease as the bandwidth was increased from 25 Hz to 100 Hz. At a flanking band to signal band frequency ratio of 0.6 (i.e. the same as used in the current experiment), there is very little contribution from a within-channel effect to the CMR because of the attenuation due to the auditory filter centred on the signal. The output of the filter centred on the signal is dominated by the on-frequency band at such spacings and thus the contribution of the flanking band is negligible. In a CDD experiment, there is no on-frequency band and so the output of the filter centred on the signal will still be dominated by the masking/flanking bands (the lower band will be the most dominant at medium-to-high masker levels as shown in experiment 4). Therefore, it is only possible to compare the contributions of within- and across-channel cues to CDD and CMR if different spacings are used in each. The differences between the predictions of the model and the within-channel component in Schooneveldt and Moore (1987) could be due to the different cues used in CDD and CMR experiments or may simply be due to limitations in the model, meaning that derivation of threshold values by using a fixed constant detection time is invalid. However, the relative values do not alter by a great amount if the detection time is altered slightly. The model predicts that increasing the bandwidth by quite a large amount will have little effect on the magnitude of the CDD. Previous work shows that increasing the bandwidth affects the CMR. The effect of increasing the bandwidth was tested experimentally by performing analogous CDD and CMR experiments.
In the earlier experiments, the task was to detect a 20-Hz wide band of noise centred at 1500 Hz. The estimated width of the critical band with a centre frequency of 1500 Hz is 180-230 Hz (Sharf, 1970; Moore and Glasberg, 1983) which is much greater than the bandwidth of the noise used. In the current experiment, it was decided to use noise bandwidths of 20, 40, 80 and 160 Hz. As these bandwidths are much wider than 20 Hz, it cannot be assumed that the noisebands would not be affected by auditory filtering. Therefore, it was decided to centre the signal at 4 kHz. The critical bandwidth at 4 kHz is in the region of 480 Hz, so even the widest band used in the current experiment (160 Hz wide) would be within one critical band.
The signal was presented with a masker consisting of two bands of noise of the same bandwidth. The masking bands were linearly spaced on each side of the signal band. The spacing used was 1600 Hz which represents roughly the same number of critical bands as the 600-Hz spacing used in the earlier experiments (1500/600 = 4000/1600). The bands were therefore centred at 2400 and 5600 Hz. Each noise band was initially presented at an overall level of 78 dB SPL (the same as the overall level of the 20-Hz bandwidth noise used in the earlier experiments). A low pass noise with a -3 dB point at 900 Hz and a spectrum level of 38 dB SPL was presented to mask any combination bands. At a level of 78 dB SPL per band, all the subjects found the stimuli to be uncomfortably loud and shrill and performed poorly. This is probably due to the headphones (Sennheiser HD414) having a 10 dB peak in their frequency response in the region of 4 kHz. This peak is designed to allow the headphones to mimic a free-field frequency response. Therefore, instead of a nominal 78 dB SPL per band, the bands were probably nearer to 90 dB SPL in level. It is not surprising that subjects found such high levels uncomfortable. Subject SB did not show a significant CDD at all at such levels. During piloting, a variety of different levels were presented to subject SB with a bandwidth of 20 Hz. The results are shown in figure 9.3.
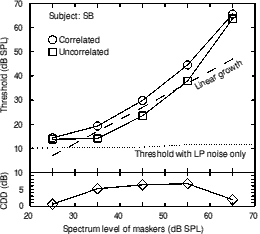
Figure 9.3. The results of a pilot study with a variety of different noise spectrum levels. All noises were 20 Hz wide.
Figure 9.1 shows that the growth of masking becomes very non-linear above a spectrum level of 55 dB SPL. This is probably due to the upward spread of masking. A spectrum level of 55 dB SPL was chosen for the experiment proper. This corresponds to a constant level per band of 68 dB SPL. When the frequency response of the headphones is taken into account, this is close to the 78 dB SPL originally desired. The masker and signal band were gated simultaneously with 50-ms raised cosine ramps and a steady state duration of 300 ms.
The CMR experiment used a very similar arrangement to the CDD experiment. The band centred at 4000 Hz was held at a constant level of 68 dB SPL to act as the on-frequency band. The bands centred at 2400 and 5600 Hz were held at the same constant level and were used as the flanking bands. A sinusoid with a frequency of 4000 Hz was used as the signal. No low pass noise was needed, as any combination tones (or bands) would be present all the time and so would not act as a cue for detection of the signal. Two conditions were used; correlated (in which the on-frequency band was correlated with the flanking bands) and uncorrelated (in which the on-frequency band was uncorrelated with the flanking bands. The flanking bands were co-uncorrelated). The reference condition with no flanking bands was not used.
The stimuli were calculated in a same way as those used in the previous experiments. Two independent 10 second tracks were calculated; one for the two bands centred at 2400 and 5600 Hz and one for the band centred at 4000 Hz. After 10 seconds the tracks could be looped back to the beginning. Continuous recordings were made onto separate tracks of a DAT tape (Sony 55ES). In the CDD condition, the band centred at 4000 Hz was used a signal. The signal level was controlled by a Charybdis model D programmable attenuator. The masker bands and attenuated signal band were added together and passed through another programmable attenuator, in order to control the overall level. In the CMR condition, the 4000Hz band was passed through a manual attenuator before being added to the bands centred at 2400 and 5600 Hz to act as masker. A 4000-Hz sinusoidal signal was used (Farnell DSG1). The signal level was controlled by a Charybdis model D programmable attenuator. The masker bands and attenuated signal tone were added together and passed through another programmable attenuator, in order to control the overall level. In both conditions, the stimuli were then passed through a manual attenuator before being delivered to the left ear piece of a Sennheiser HD 414 headset.
The same procedure was used as in experiment 1.
Three subjects participated, all with absolute thresholds less than 10 dB HL at all audiometric frequencies. All subjects had extensive practice having previously completed earlier experiments.
The results of experiment 7 are presented in figure 9.4.
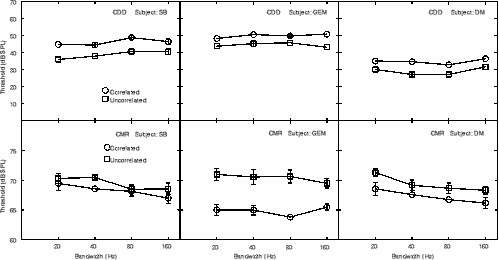
Figure 9.4. The results of experiment 7 for all subjects and both conditions. Error bars show the standard deviation.
The upper row in figure 9.4 shows the results for the CDD condition. As the bandwidth increases, neither the absolute levels nor the relative differences alter very much, i.e. the CDD remains almost constant at an average of 6.2 dB. The absolute levels should not alter greatly as the long term noise power was held constant as the bandwidth was altered (for short presentations and narrow bandwidths there may be a trial-to-trial difference due to only a few envelope periods being presented). The within-channel model predicted little or no difference as the bandwidth increased, at least up to a bandwidth of 80 Hz. The results of the experiment are generally consistent with the predictions of the model except that the drop in CDD predicted at a bandwidth of 160 Hz is not seen in the experimental data. This is probably due to the model smoothing out the envelopes too much. The model was calibrated for bandwidths of only 20 Hz. At larger bandwidths, the window size (12.5 ms) will approach the mean period of the envelope (a bandwidth of 125 Hz would give a mean period of 12.5 ms). The effect of over-smoothing the envelopes would be to reduce the difference between correlated and uncorrelated maskers. It is expected that there will be bandwidths at which there will be little or no difference between the conditions. However, the window size of the model may be underestimating this bandwidth. The model also predicts small increases in threshold as bandwidth is increased (see table 9.i). The predicted small increase is seen in the data as shown in figure 9.5 which shows the average results in the CDD condition across all three subjects.
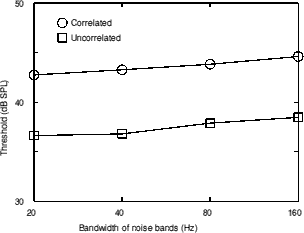
Figure 9.5. The results of experiment 7 averaged across all three subjects.
The lower row in figure 9.4 shows the results for the CMR condition. Only correlated and uncorrelated conditions were run; there were no conditions without the flanking bands. Therefore the results shown only give information on CMR(U-C) and not CMR(R-C). Fantini et al. (1993) showed that the CMR(R-C) values for an analogous paradigm are extremely variable and are sometimes negative, so this is not considered to be a flaw. In all conditions for all subjects, the threshold for the correlated condition is lower than for the uncorrelated condition which is the "correct" way round (n.b. this is the opposite way round to the results for the CDD experiments). There is no consistent change in the CMR as the bandwidth increases. However, the results are very variable across subjects. Only subject GEM shows a large CMR; indeed subject SB does not show a significant CMR at most bandwidths. Some of the results of Schooneveldt and Moore (1987) are comparable to those of the present experiment. They used a 4000Hz centre frequency for the signal and on-frequency band with a bandwidth of 25 Hz and the same flanking band frequency/signal frequency ratio of 0.6 which is equivalent to the lower band in the current experiment (they only used one band). The condition described showed a CMR(U-C) of about 8 dB. Only subject GEM shows a CMR of a similar magnitude. The lack of CMR in the other two subjects is disappointing, but not unique (Fantini et al., 1993). Subjects SB and DM had very stable results; practise did not seem to increase the CMR, though it is possible that it may have done in the long-term. Why then should there be such a difference across subjects? None of the subjects had performed a CMR experiment before, but they had all had extensive practise over a number of years on CDD experiments. It is possible that subjects SB and DM were consistently using CDD-type cues such as within-channel phase-locking to perform detection in the CMR condition. The thresholds for the uncorrelated condition are similar for all subjects, but only GEM has much lower thresholds when the flanking bands are correlated, i.e. only he was able to make significant use of across-channel detection cues. Fantini et al. (1993) and Moore and Jorasz (1992) have discussed the balance between interference effects, probably related to Modulation Detection Interference (MDI), and processes giving CMR. MDI is the phenomenon where modulation detection of one component is more difficult when a component at another frequency is modulated at a similar rate. Subjects may have differed in their susceptibility to interference and the balance between CMR and interference. Substantial individual differences have been reported in susceptibility to interference/MDI effects (Moore et al., 1990b; Hall and Grose, 1991; Moore and Jorasz, 1992). The results of Fantini et al. (1993) in a CMR experiment showed that adding an uncorrelated flanking band generally increased threshold. For their highest frequency condition, which is probably the most similar to the current experiment (a signal frequency of 6 kHz), the results were more interesting. Adding a flanking band, however correlated, increased the threshold for two of the three subjects by a minimum of 5 dB, sometimes much more. This shows that there is a significant amount of interference occurring. The amount of interference is higher at the higher frequencies. MDI tends to be markedly greater under conditions where the interfering sound is synchronous with the signal (as in the current experiment) than when it is continuous or asynchronous (Hall and Grose, 1991; Moore and Jorasz, 1992; Moore and Shailer, 1992). The present CMR experiment was meant to be as similar to the CDD condition as possible. It is unfortunate that such conditions do not produce a consistent CMR across subjects.
As previously discussed, the Sennheiser HD414 headsets used in the current experiment show a peak in response of about 10 dB in the region of 4000 Hz. This would make the on-frequency band much higher in the level than the flanking bands. CMR has been shown to be highly dependent upon the level difference between the OFB and the flanking bands (McFadden 1986; Hall, 1986). A 15- to 20-dB difference is sufficient to reduce the CMR to zero (Hall, 1986). The peak in response was not allowed for in the current experiment and so the level difference may account for the small CMRs seen. However, Schooneveldt and Moore (1987) used the same headsets in their 4000-Hz signal condition and did not allow for the peak. Their results showed quite large CMRs, as discussed above.
The results of experiment 7 are not completely conclusive. The results of the CDD condition are broadly consistent with the predictions of the within-channel detection time model, however there is no drop as bandwidth increases. CMR experiments show a large effect of modulation rate (which for narrowband noise stimului is proportional to bandwidth) on the magnitude of the sharply-tuned within-channel component of CMR (Schooneveldt and Moore, 1987), but little or no change in the across-channel component (Carlyon et al., 1989). If one assumes that across-channel processes in CMR and CDD are the same, this is consistent with an across-channel mechanism for CDD. However, it is unlikely that the CDD in the current experiment is entirely due to an across-channel mechanism (as shown by previous experiments). Also, the smoothing of envelope in the model was probably excessive, making the decline in predicted CDD too large.
The CMR condition shows that there is no difference in CMR with bandwidth, but as two of the three subjects showed very small CMRs, it is possible that the conditions used (and the vast experience in performing CDD experiments which, as concluded above, probably involve different mechanisms) did not promote large or consistent CMRs across or within subjects.
Apart from the differences in CDD with bandwidth, the fact that a significant CDD is seen at high frequencies is itself interesting. The discussion of within-channel mechanisms so far has not discussed the actual mechanisms for detection. Unlike across-channel mechanisms such as dip-listening or correlation detection, there are no simple comparisons to be made. What cues are used to indicate the detection opportunities discussed in chapter 6? In other words, how do subjects know when to listen?
One possible mechanism is neural phase-locking. In response to a pure tone, the nerve firings tend to be phase locked or synchronized to the stimulating waveform. If a complex waveform is presented, the nerve firings tend to be phase locked to the dominant frequency at the appropriate position on the basilar membrane. For the purposes of this discussion, the narrow band noises used in the experiments can be considered to be pure tones with a moderate random amplitude modulation and a small random frequency modulation. The small FM component can be disregarded as it is insignificant compared with the frequency differences between the bands. When only the masker bands are presented, the shallow low-frequency skirt of an auditory filter centred at the signal frequency attenuates the lower masking band less than the steeper high-frequency skirt attenuates the upper band. The dominant frequency will be the centre frequency of the lower band and thus the nerve firings will be phase locked to that. When the signal band is present, the dominance in phase locking would shift towards the signal frequency at times where the signal was dominant in level. If the signal was correlated with the maskers, as the signal level increased and decreased randomly, so would the masker level and so the dominance would not alter greatly unless the signal were much increased in level. If the signal were uncorrelated, there would be times where the signal was at a high level and the masker was at a low level. This would not have to be true for the whole 300-ms steady state presentation of the signal. Only a small number of detection opportunities would be required in which the dominant phase locking would alter thus providing a cue. The shaded bands in figure 9.4 show where detection opportunities may occur.
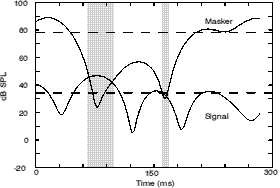
Figure 9.4. An example of waveform envelopes with sections of signal dominance or 'detection opportunities' shaded.
Even if the signal band were not wholly dominant, the pattern of phase locking would be altered when the signal was present. Phase locking does not occur over the whole range of audible frequencies. The upper frequency limit appears to lie at about 4-5 kHz (Rose et al., 1968). Therefore at the signal frequency used in experiment 7, there would be little, if any, phase locking. However, this does not mean that phase locking does not play a role in detection. There would still be phase-locking to the lower frequency band (which was centred at 2400 Hz). When the signal centred at 4000 Hz was presented, the pattern of phase locking would still be disrupted, even if there was not complete phase locking to the signal frequency. The upper limit to phase locking is not determined by the maximum firing rate of the neurones. Rather it is determined by the precision with which the initiation of the nerve impulse is linked to a particular phase of the stimulus. An interspike interval histogram (Rose et al., 1968) shows a spread in the timing of each peak of the histogram. At higher frequencies, the spread is of the same order of magnitude as the period of the waveform which means that all the peaks smear together. Such a smearing in the phase locking would be an effective cue when used in comparison with clear phase locking to 2400 Hz. It is unclear however, whether the phase locking cue would be insensitive to modulation rate (bandwidth). There is some evidence that phase locking mechanisms are unable to follow rapid changes in the pattern of phase locking (Moore and Sek, 1996).
Another cue that could be used is the rate and depth of envelope fluctuations in the signal channel. If a masker and a correlated signal are added together in one channel, the rate and depth of the envelope fluctuations will not change. The envelope fluctuations will remain the same with and without the signal present. Only the long-term RMS level will be altered. If a masker and uncorrelated signal are summed in one channel, the maxima of one and the minima of the other will tend to cancel to some extent. The sum of the two uncorrelated envelopes is different in form to either of the individual envelopes. The dips in either waveform tend to be filled in by the other waveform, so that the resultant is much flatter than either of the inputs. Also, there will be a small rise in the number of maxima and minima, as a large maximum may occur in a minimum of the other component thus giving rise to a small local maximum. Therefore, the envelope at the output of the filter provides a cue for signal detection in the uncorrelated condition.
To illustrate the importance of the envelope summation, a simulation was run using components of the model in chapter 6. 1000 300-ms bursts of masker and signal were calculated. The bandwidth for all bands was 20 Hz. The envelope of each burst was calculated. The mean number of maxima and minima in each burst was calculated. The instantaneous deviation in the envelope from the long-term RMS value was calculated at each minimum and maximum and the mean deviation was calculated. The masker and signal envelopes were added together with the signal band 3.56 dB lower in level than the masker. This was done to simulate the summation of the masker and signal in the signal channel. The attenuation of 3.56 dB was used as it was the criterion signal-to-masker ratio for a detection opportunity in the original model. The mean number of maxima and minima and the mean deviation from the RMS masker value for each were calculated. The results are presented in table 9.i.
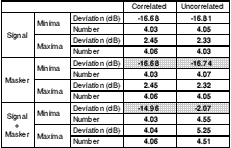
Table 9.i. The results of calculating the mean number of maxima and minima and the mean deviation from the long term masker RMS value in 1000 300ms bursts of masker and signal. A window of 12.5 ms was used to calculate the envelope.
In the correlated condition, the masker and the signal have almost the same numbers of maxima and minima and the mean levels of those maxima/minima are also the same. This is, of course, expected. In the uncorrelated condition, the masker and signal are also very similar in terms of their individual envelope properties. When the masker and signal are summed, however, a large difference is seen between the two conditions. In the correlated condition, there is just a small (1.6 dB) rise in the level of both the mean minima and maxima deviations. This corresponds to a small rise in the overall long-term RMS level. The number of maxima and minima remains the same. In the uncorrelated condition, there is a small rise in the average deviation of the maxima, but there is a very large decrease in the absolute deviation of the minima from 16.74 dB to only -2.07 dB. In the uncorrelated condition, the mean maxima/minima ratio for the masker alone is 19.06 dB; for the masker and signal summed it is 7.32 dB. Therefore, the envelope is much flatter. There is also a 12% increase in the number of maxima and minima.
It is possible that the apparently flatter envelope found here was partly due to the temporal smoothing used to calculate the envelope. A 12.5ms window was used, over which the instantaneous RMS level was calculated. This may have smoothed out brief fluctuations too much. To assess whether this was the case, the simulation was repeated with a 6.25ms window. The results are shown in table 9.ii.
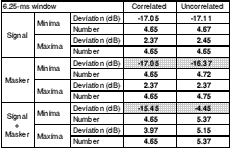
Table 9.ii. The results of calculating the mean number of maxima and minima and the mean deviation from the long term masker RMS value in 1000 300ms bursts of masker and signal. A window of 6.25 ms was used to calculate the envelope.
The results are extremely similar for the two window sizes. Adding an uncorrelated signal shrinks the maxima/minima ratio from 19.42 dB to 9.60 dB and a 15% increase in fluctuation rate is observed. It can be concluded that, within limits, the temporal smoothing in the envelope calculation has little effect on the results of the simulation. If there were no smoothing at all, the envelope calculated would be the same as the input waveform which has a much larger number of zero crossings and a larger maxima/minima ratio.
The role of envelope cues has been discussed by Schooneveldt and Moore (1987), Wright (1990) and Green et al. (1992) amongst others. Schooneveldt and Moore (1987) discussed the regular zeros in the envelope produced by beating when the on-frequency band and flanking band are close in frequency in CMR experiments. Only regular zeros are seen when the bands are correlated. Wright (1990) discussed the same with respect to the signal and masking bands used in CDD experiments. The discussion of beating takes the fine structure into account whereas the envelope summation method described above only takes the envelope fluctuations into account. The conclusions are qualitatively the same however (if not quantitatively); uncorrelated bands produce flatter envelopes (i.e. peaks and dips are smaller and zero crossings are fewer).
In summary, there are clear cues present that could be the basis of CDD in a within-channel mechanism. The phase locking of the neurones firing in response to excitation at the part of basilar membrane corresponding to the signal frequency is one cue. When the masker and signal bands are uncorrelated (i.e. the signal-to-noise ratio, SNR, is constantly altering by a large amount), the pattern of phase locking will tend to be dominated by the signal when the SNR is high and the masker when the SNR is low. There will be times even at moderate signal levels, when the amount of time in which the phase locking is dominated by the signal frequency is sufficient for signal detection. When the masker and signal bands are correlated, the signal band has to be at such a level that the signal frequency is always dominant in order for it to be detected (as the SNR remains constant and so there are no 'dips' to detect the signal in). The other cue that could be used is the change in modulation of the envelope when the signal is present. When the masker and signal are correlated, adding the signal does not alter the ratio between the mean maxima and minima levels (i.e. the flatness) or the number of maxima/minima (i.e. the modulation rate). If the signal is uncorrelated with the masker, then when the signal is present, the modulation rate increases and the envelope also gets much flatter.